Intelligence Graph
The market, mapped and kept current.
Who matters in a market, how they connect and what is changing. One graph, kept current by our agents, with the evidence for every fact.
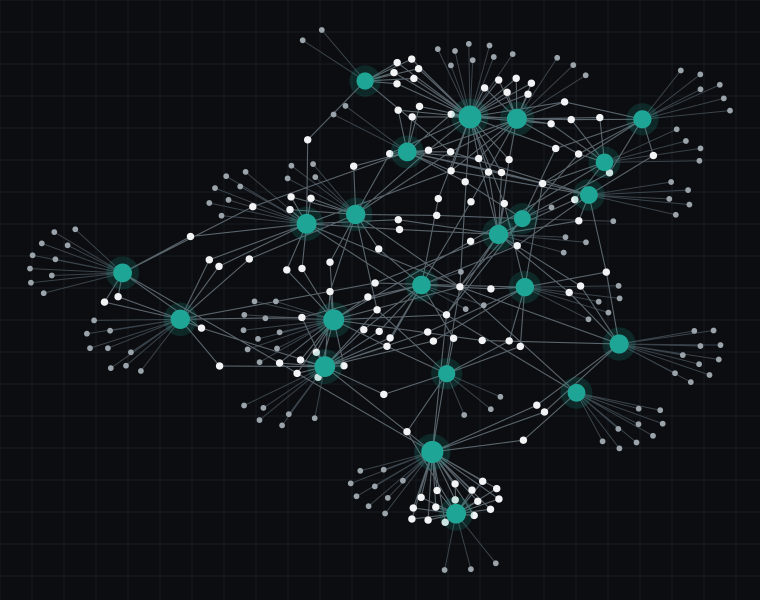
The Intelligence Graph is the outside view of a vertical: the market around it, as it moves.
What it holds
Players, relationships and signals, joined.
Each one joined to the facts about it, and every fact graded.
Players
Who is in a market, and what each one does.
Relationships
Who backs whom, with the source for every link.
Signals
What moves in a market, and what goes quiet.
Timing
When something changed, so you can act in time.
Located
Placed on the map, not just listed.
Organisations are placed where they are, so a market can be read by city and region, and a new cluster can be told apart from noise.
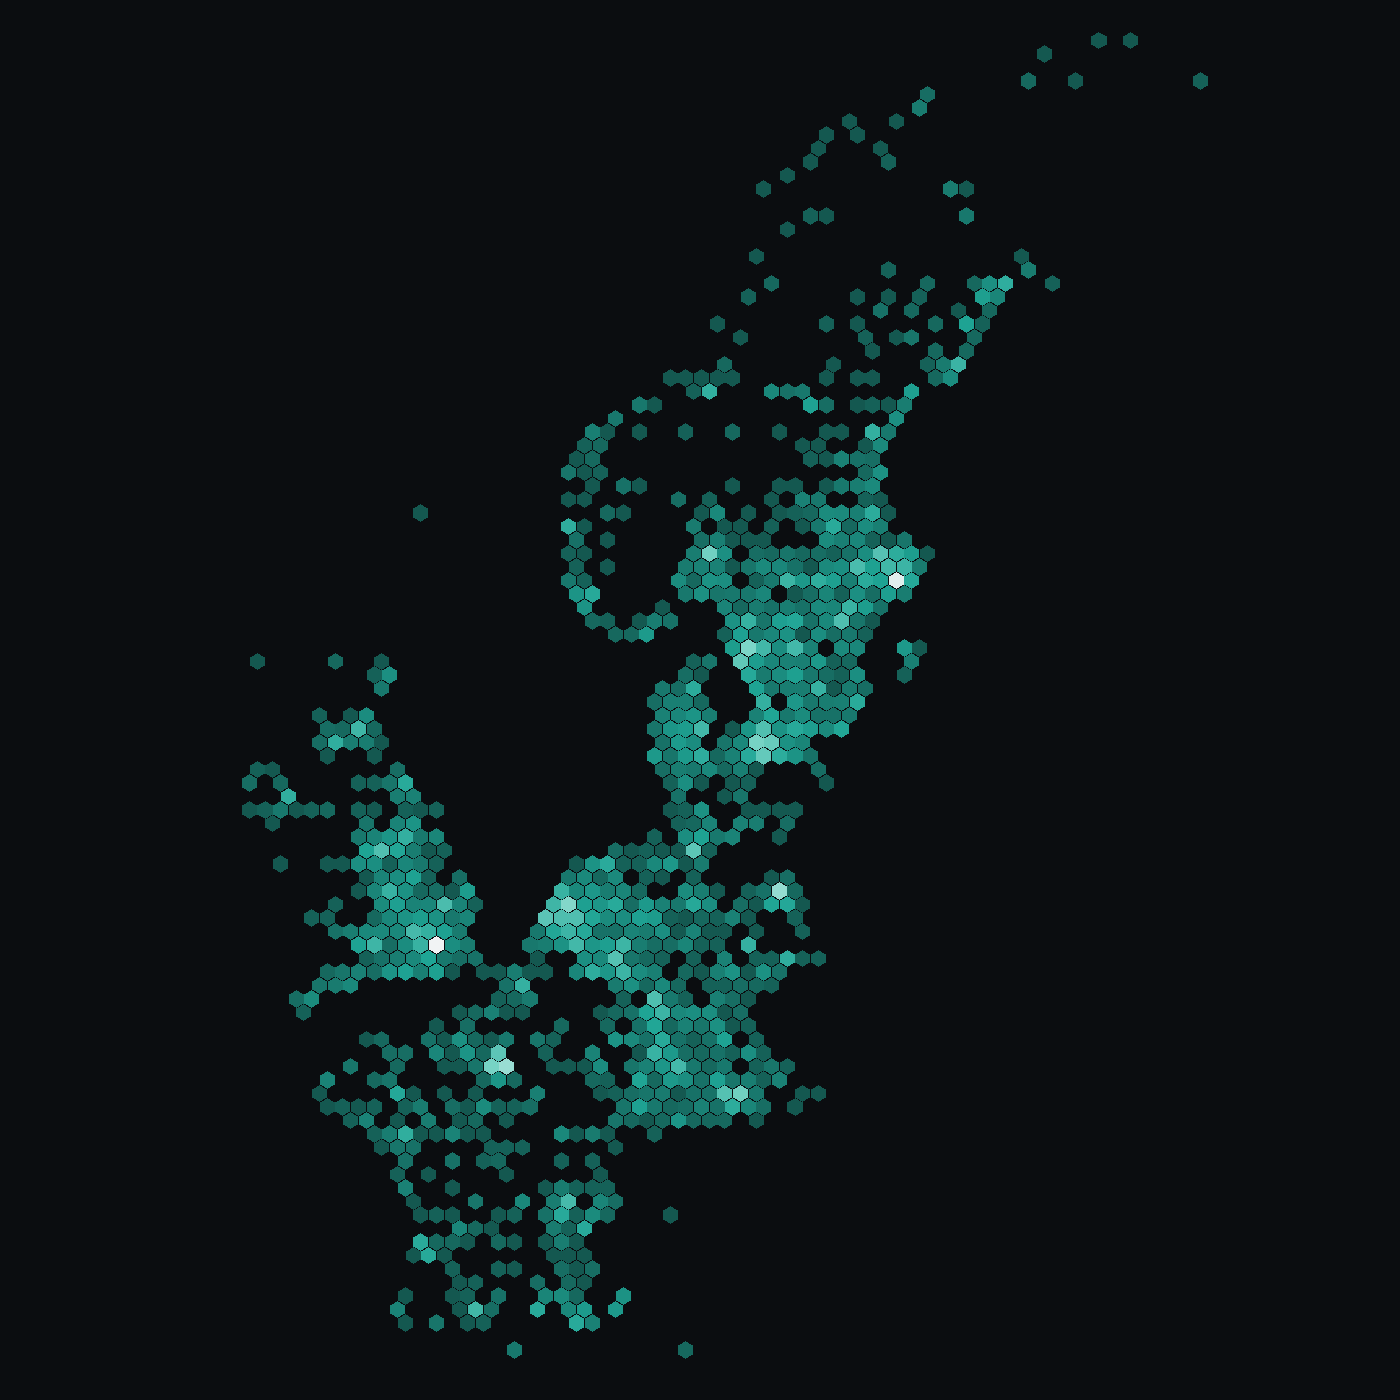
Europe, where we are based. Every organisation sits where it is; names are left out.
Sources
Every fact can be traced to its source.
The graph is only as good as what it is built from, so every fact meets the same standard.
- Traceable.Any fact can be followed back to where it was found, and when.
- Within its terms.We record what each source allows us to do, and stay inside it.
- Followed over time.A market is tracked as it moves, so a company that goes quiet shows up as a change, not a stale record.
- Accountable.The graph records how it came to know each fact, not only the fact itself.
Applications
Applications are views of the same graph.
A new application starts from everything the graph already knows.
Sales intelligence
The technology market, account by account, for teams that sell to tech companies.
Care market intelligence
The Swedish care market, mapped for healthcare staffing: who provides care, and where. In development.
Portfolio intelligence
For funds and ecosystem builders: every company in a portfolio, followed over time.
Bring a market. We will show you what the graph already knows.
A first briefing covers what the graph holds on your market, where it is thin, and what it would take to go deeper.